Geovisualisation Challenge Blueprint
Geovisualisation Challenge - what?
Learning geovisualisation via real-world cases to solve timely challenges in the societies. Geovisualisation Challenge is a fun and innovative way to learn the power of maps and visualisation of geospatial data that can bring solutions to challenges faced in different living surroundings and communities. Students are invited to work in teams to come up with solutions to a timely issue provided by a client with needs that geovisualisation can answer to. The client provides the overall theme, but the student groups narrow down the theme themselves to a smaller entity.
For example, city's public transportation department is in the process of planning new tramlines across the city. Tramlines change the urban fabric in many ways: by reducing the need for traditional buses, by crossing through a green area, or by increasing attraction for new apartment buildings along the rails. This broader theme can be looked at from multiple angles, which allows the students to narrow down an actionable problem that they are interested in. Geovisualisation Challenge could provide useful information and possible solutions for the planning process - and a great chance for the students and the stakeholder to network together!
Higher education -level students
/
Duration of 4 to 5 weeks
/
Cooperating with industry partners
How the challenge is organised in practice?
This blueprint is made based on Geovisualisation Challenges organised both during a university-level course in the Department of Geography and Geology at the University of Turku, and also as a standalone event for higher-education level students in five Tanzanian universities. The practicalities summarised to this blueprint are an example of how the challenge can be carried out. Modifications in the duration, target group, themes, and stakeholders can always be done.
As a part of course
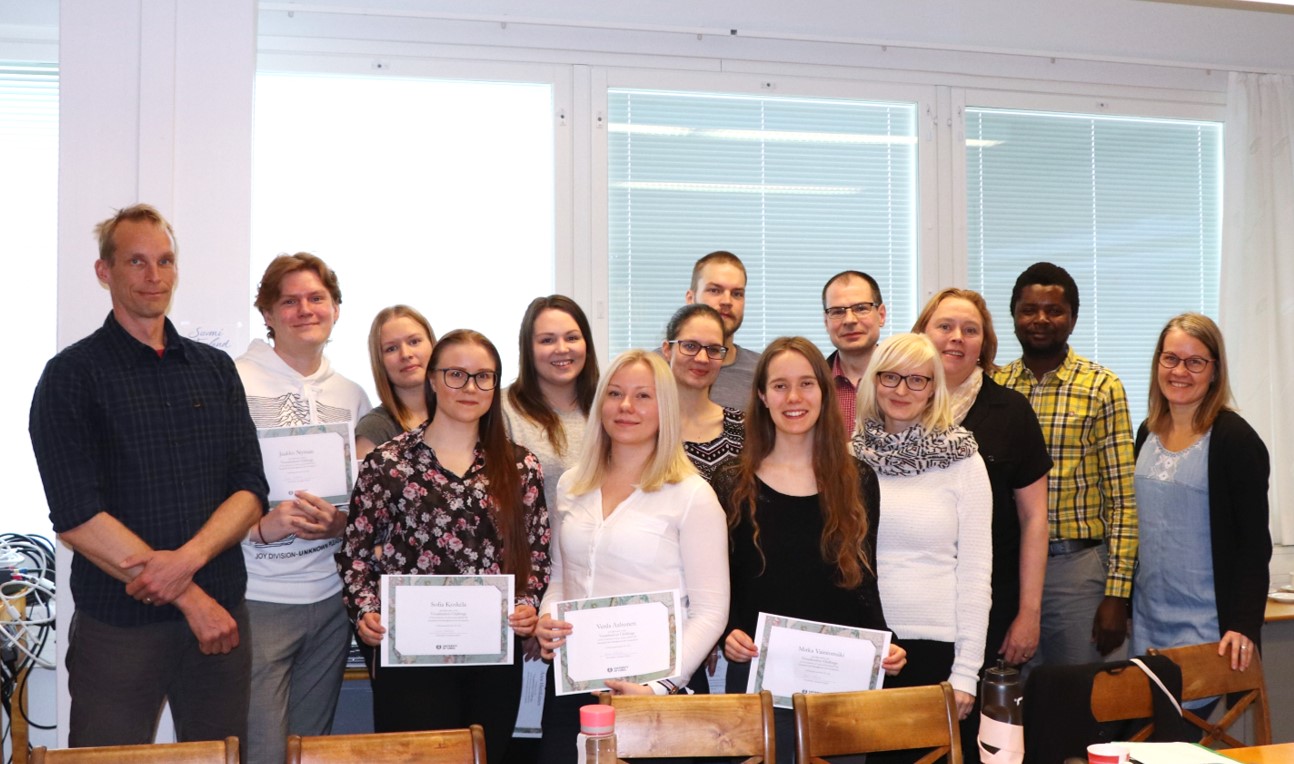
"Geospatial data management and visualisation" is a course at the University of Turku, available for master's students with some previous experience with geospatial data and GIS. Although the course is ran on the Department of Geography and Geology, it is available for other disciplines as well. Students from disciplines like biology, IT and computing have been warmly welcomed to the course.
Duration
The course runs whole fall semester, and the Geovisualisation Challenge is held during the last 4 to 5 weeks of the course. Other durations are of course also possible, but it is important to give the participants enough time to work on their solution - coming up with the idea, finding suitable datasets, processing them, and creating the technical implementation.
Supporting resources
All students on the couse have been obligated to read recent scientific articles that discuss about geovisualisation. In addition to that, the students have completed a set of online learning practicals that provide useful skills for using different geovisualisation tools, such as the mini-MOOC Working with interactive web-maps. During the challenge, other relevant materials has been shared via the course Moodle-site.
Students and groups
All students partaking the course participate also the challenge. Student team sizes have varied between 3 to 5 persons. Usually the students have different interests and skills they have aquired during their studies, and thus the ideal way to form the groups is to ensure variety in skills. Some might be great in holistic understanding of phenomena, some enjoy data science, and others are into coding.
Stakeholders / client
Each year, there has been a different local stakeholder who has provided a theme for the challenge, such as Lounaistieto, Metsähallitus, and the Regional Council of Southwest Finland. They have had ongoing projects that would benefit from geovisualisation solutions that combine geospatial data in meaningful ways.
Geospatial data
In Finland, the accessibility of open geospatial data is rather good. Thus, the student teams have searched for suitable datasets themselves. In some cases, possible data sources has already been identified by the client.
Solution requirements
The technical implementation of the solution must be an interactive web-map. Before the challenge, all students learn to use the QGIS2web plugin, which ensures that each group masters at least one technical tool to create such maps. Other open-source tools can also be used.
Mentoring
The course teachers mentor the groups regularly, usually once a week. Mentoring ensures all groups are working efficiently, and problems can be overcome quickly. Last mentoring session is the pre-finals before the closing event, where the groups practice their pitches and present the solution.
Final event
The teams prepare a 10-minute pitch to present their solution idea for the client, the other groups, and a panel of judges. The judges are usually 4-5 people who can be the course teachers, other staff members, and a representative from the client. The judges evaluate 1) the justification of the solution, 2) clarity of the delivered message, 3) quality of the geovisualisation, and 4) novelty and technical performance of the solution. One group is nominated as the winner, and is awarded with some small prices (e.g. a book from the client, or snacks). Everyone is handed a certificate.

As a standalone event
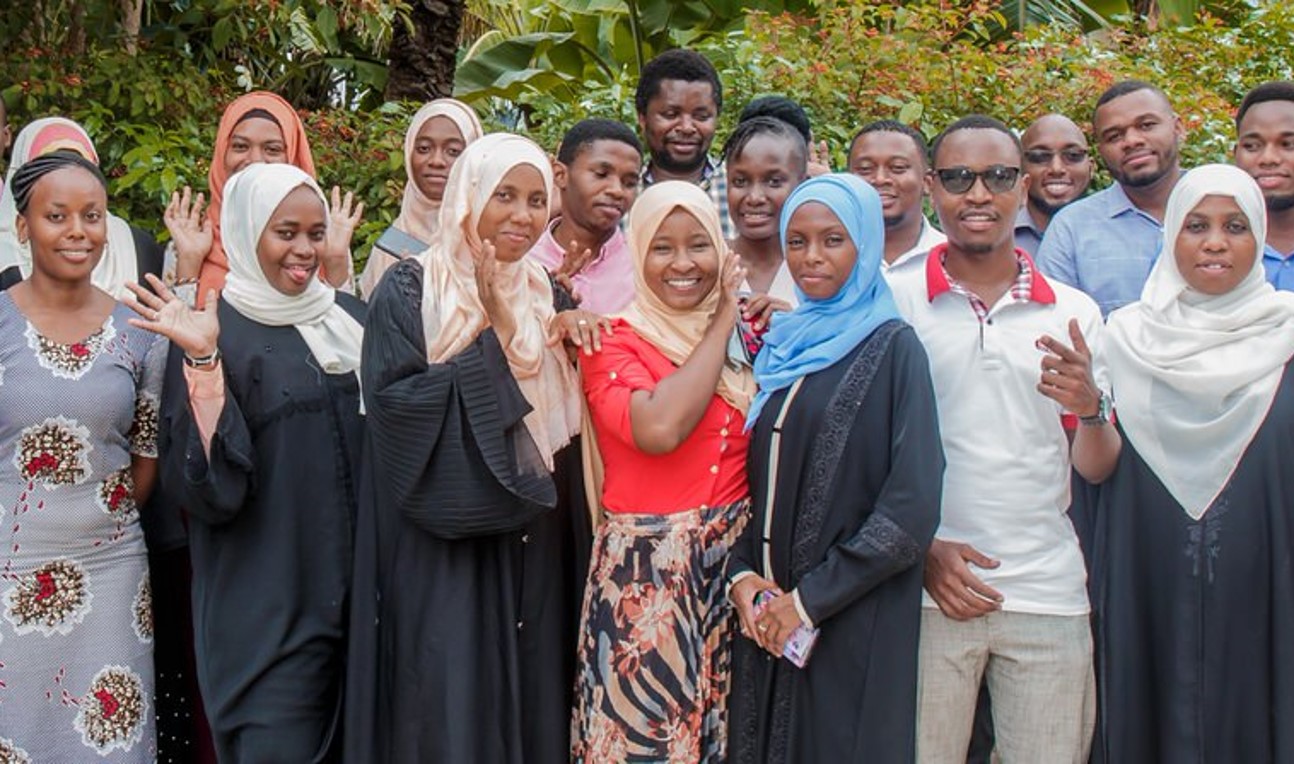
Tanzania Resilience Academy has organised Geovisualisation Challenge events for higher-education level students in Tanzania. The challenge has been advertised in five Tanzanian universities with Geo-ICT related programs. The client for the challenges was the World Bank that also funded the Tanzania Resilience Academy when it was in it's project-phase.
Duration
The challenge itself lasted for 4 + 1 weeks, where after four weeks ten groups were selected to continue to finals. Advertising for the challenge was started in good time before hand. The advertisement already contained the challenge theme, which helped student teams to apply for the challenge with a short initial idea of their solution. Application period was two weeks.
Supporting resources
All students were provided with openly available online learning materials of good practices in geovisualisation, as well as with technical tool tips. The learning materials are available on the Digicampus platform: Geovisualisation principles and examples and Geovisualisation tools.
Students and groups
Bachelor and Master's students who were interested in partaking the challenge formed their teams already during the application period, and applied together. All in all, there has been around 150-200 individuals participating in the Tanzania Resilience Academy Geovisualisation Challenge each time it has been organised!
Stakeholders / client
In all of the Resilience Academy organised challenges, the client has been the World Bank with ongoing urban infrastructure related projects taking place in Tanzania and Zanzibar. These projects have provided great umbrella themes for the challenges, such as drainage infrastructure and urban flooding, traffic and public transportation, and benefits of urban greenery.
Geospatial data
Students were given a list of openly available geospatial datasets from Climate Risk Database they could utilise in their solution. Other data sources were also allowed, such as the OpenStreetMap and Earth Observation data repositories.
Solution requirements
Technical requirements for the solution were rather loose due to differences in the students' backgrounds, programs and ages. The final solution could be anything from a statick map to an interactive web-map or a story map.
Mentoring
Each university had dedicated staff members as mentors for the challenge. Thus, the student groups had always someone at their home university to turn to when stuck or needing ideas forward. The mentors had all expertice in GIS, geospatial data management, Geo-ICT, which ensured also access to technical advice.
Final event
After four weeks of working, all groups submitted their visualisations for the organisers. A panel of judges selected 5-0 best groups to continue to the final week, where pitches and presentations were rehearsed. The Tanzania Resilience Academy Geovisualisation Challenge final event has been a big gathering together due to large number of participating students. The best groups that were selected to the final event presented their solutions to the client, students, mentors, and organisers. Prizes (300, 200 and 100 dollars) were given to 1st, 2nd and 3rd place groups, which was a huge motivation for the groups to present well-thought and executed visualisations.

Effective skills application
Students learn principles and techniques of geospatial data visualisation via a hands-on visualisation challenge. This puts students to design geospatial information dissemination with smart visualisation solutions. They will apply their previous knowledge on finding suitable data, processing it to desired format, combine with other information sources, and visualise them in a meaningful way. Trying out new tools and techniques is encouraged for added skills development.
In addition to technical skills, students also learn time management, team working, disseminating tasks, communicating with stakeholders, and pitching their solutions to an audience in a professional manner.
Examples of guiding questions for student groups when planning their visualisation solution:
- What needs does the challenge owner have?
- Which topic(s) and datasets will you choose to work on?
- What actions and impact would you like to enable with your geovisualisation?
- What datasets enable transformatino of data to dynamic visualisation?
- What datasets are available and what to choose?
- What tehcniques help you best to build the story?
- What tools and tehcnologies work for the delivery of the solution?
- How do you need to manage the data and other information sources?
- How to process geospatial and other datasets?
- How to tell a story that highlights the importance of your solution to the client?
Get to work!
Are you ready to organise a Geovisualisation Challenge? Gather a team to start thinking about practicalities and modifying the challenge suitable for your local context.
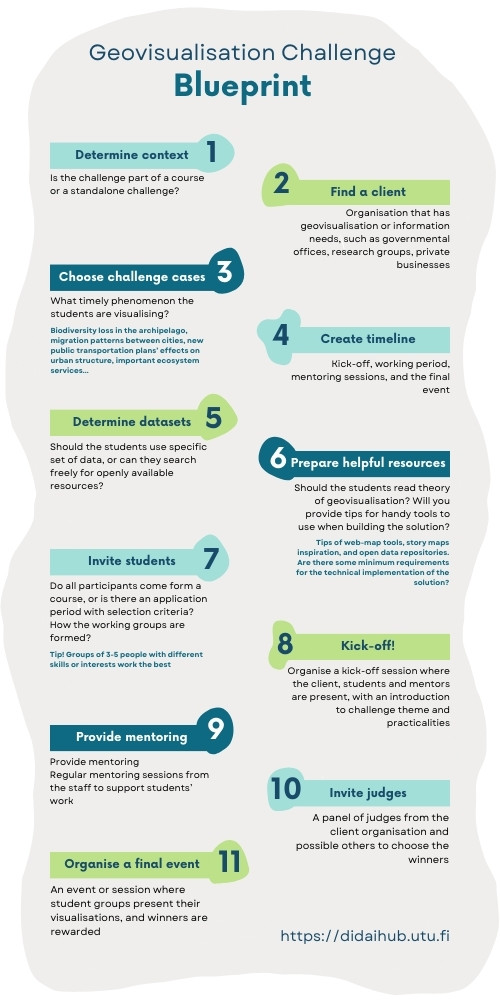
Download below the step-by-step blueprint as a PDF.
